Made with postermywall
Good day, friends. Today, I will be exploring how to use the javascript programming language to get data from an external source. At the end of this post, I will plot a graph that shows the global temperature change since 1980 using CSV data from the National Aeronautics and Space Administration (NASA). We will be using the chat.js library and HTML to accomplish this. Let's get started.
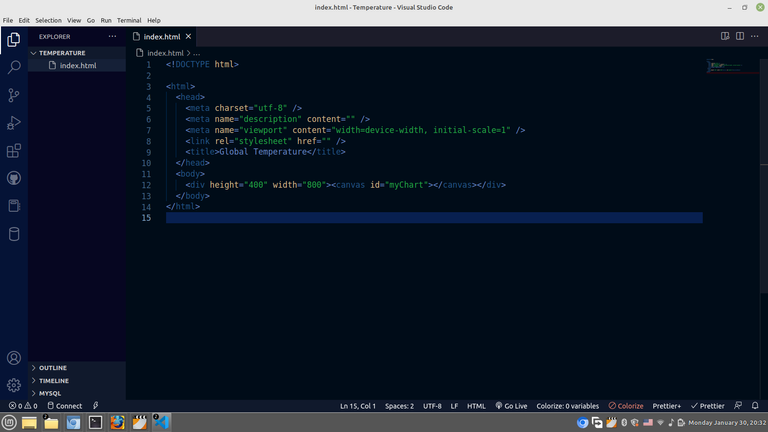
Step 1: Creating an HTML file to display the graph on the webpage
The first thing we will do is create an HTML index file to display our data on the webpage. Because I will be plotting a graph, I will add the canvas element to my HTML file, and that is what we will use to display the graph. The screenshot below shows our HTML boilerplate to get started. I have included the canvas in a 400 x 800 size. I have also included the chart. Js CDN because that is what I will be using to plot the graph.
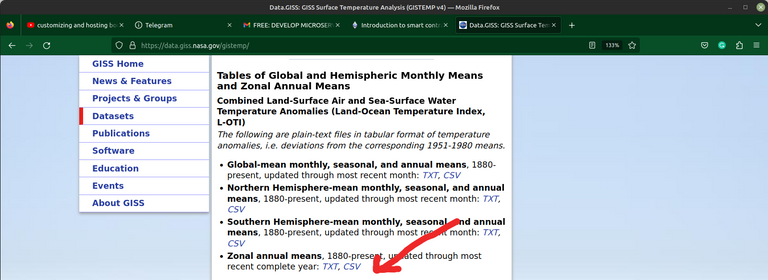
Step 2: Getting the CSV data from NASA's Goddard Institute for Space Studies.
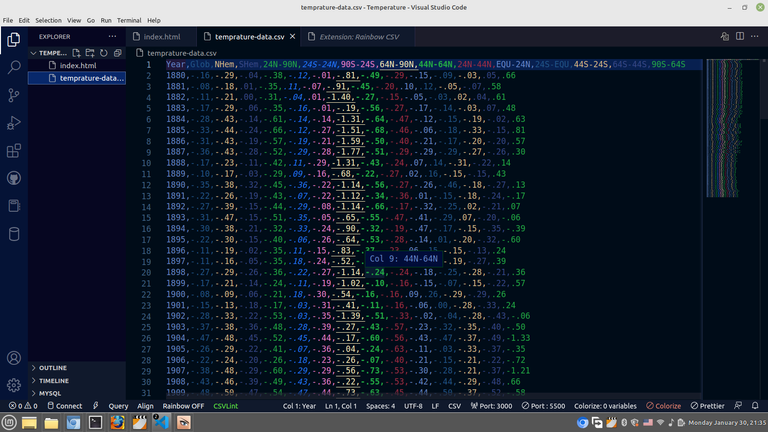
Viewing the csv data in Visual studio code
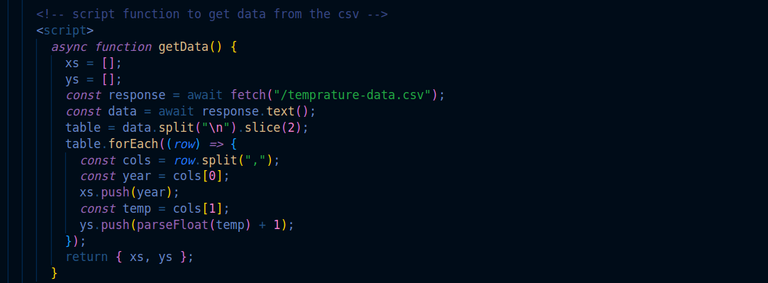
Step 3: Creating a Javascript function to get the data from the CSV file.
I will embed the Javascript code in my HTML file, so I opened a new script inside my HTML to contain the Javascript codes. Here, we create a javascript function named, getData(). In this function, we will be using the Javascript Fetch API to fetch the data from the CSV file, which we can then use for the graph. In Javascript, if you want to get data from a different source, you use the Fetch API. You can also use it to share data between a client and a server. The screenshot below shows the function. The screenshot below shows the code to get the CSV data.
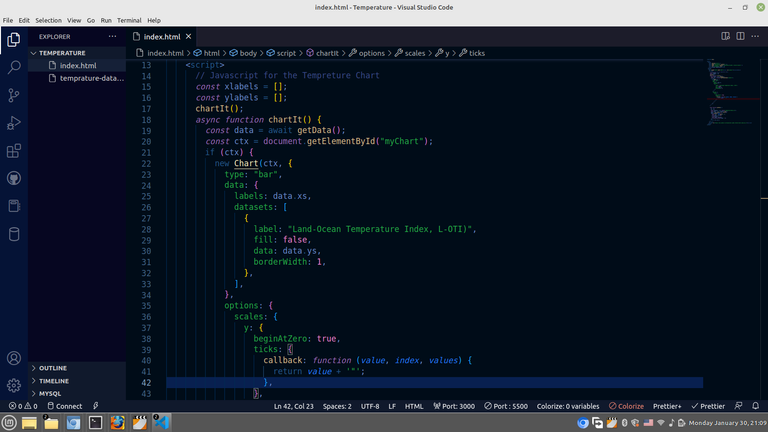
Step 4: This is the final stage. where we create another function to plot the graph. In this function, we will be using Chart.js that we have added to our HTML file. This is where all the labels and the graph's customization are added. The code is shown below.
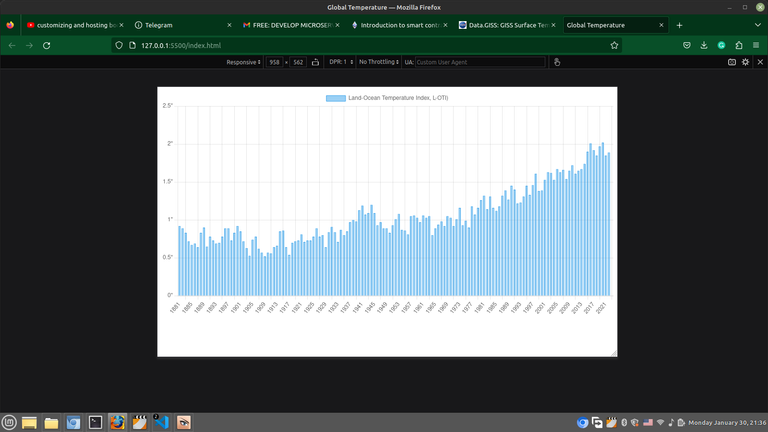
Finally, the graph is ready. It shows the global average temperature change using the annual zonal means. You can clearly see that there has been an increase in global temperatures since 1980.
I hope you found this useful. I am Abdul-Salam Issahaku, from Ghana. I am a student web developer and a blockchain enthusiast. I blog about technology and investments. You can follow me to be part of my Hive family. Thank you for your time.
All images used in this post are screenshots from visual studio code.